|
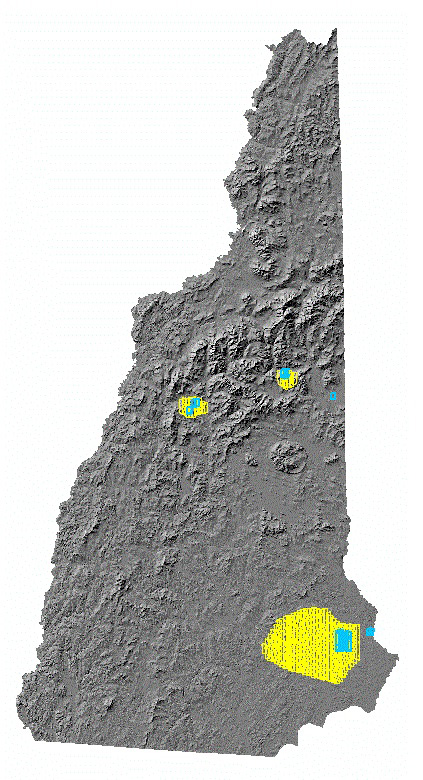
NH Flight Map |
Spectral Reflectance Patterns |
|
|
|
|
Spatial extent of airborne imagery collected for the NH EPSCoR Ecosystems & Society project. Yellow lines indicate image flightlines collected during peak growing season (August 2012); blue lines indicate image flightlines collected during winter (Feb/Mar 2013). |
Spectral reflectance patterns across the region of the electromagnetic spectrum from 0.4 to 3.0 micrometers—the range captured by the aircraft sensor, which includes visible wavelengths as well as near and shortwave infrared wavelengths. The patterns here depict the proportion of solar radiation reflected or absorbed from the land surface across different land surface types—well beyond what we can see with our eyes. |